E124: Klauber triangle structure
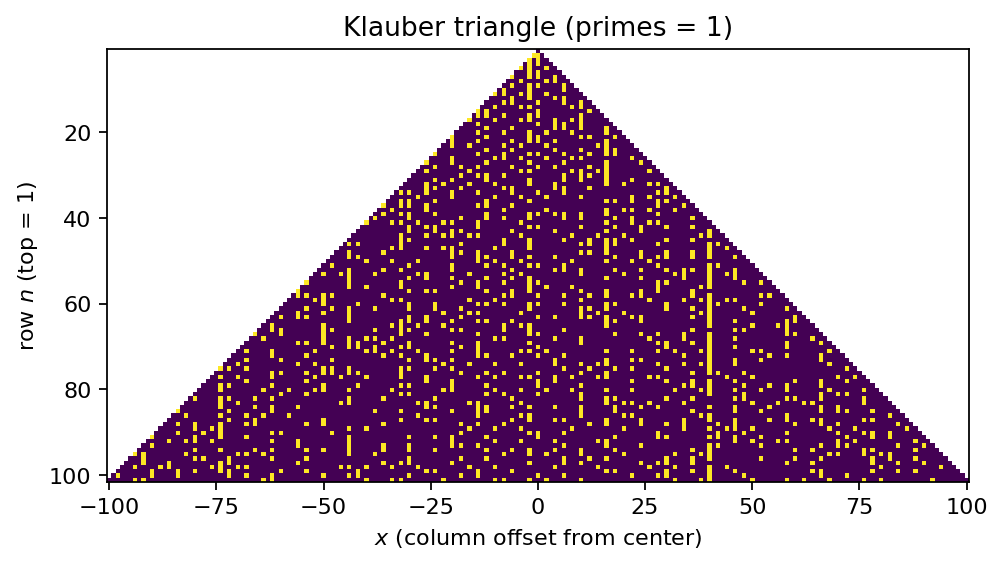
size 101: 10,201 numbers and 1,252 primes
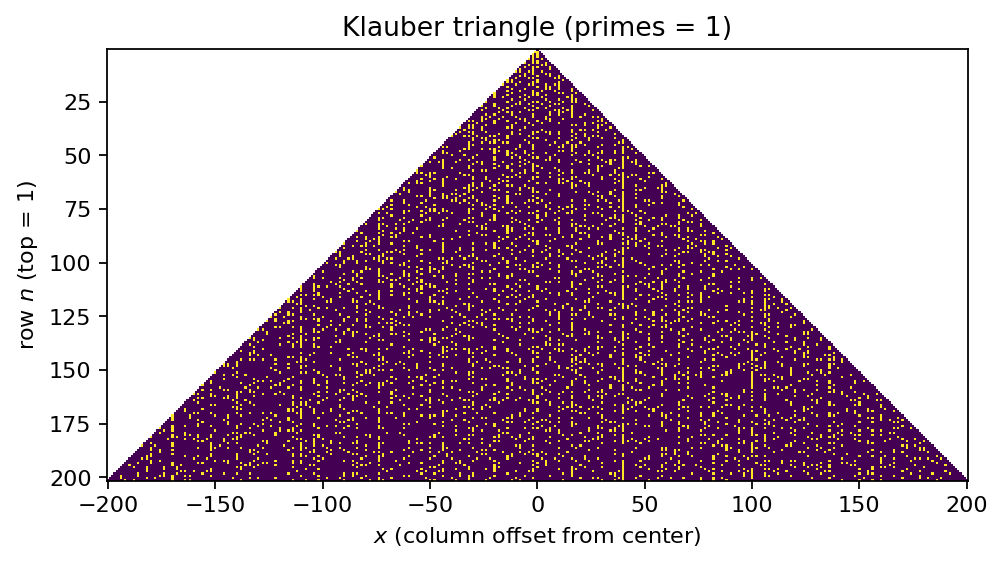
size 201: 40,401 numbers and 4,236 primes
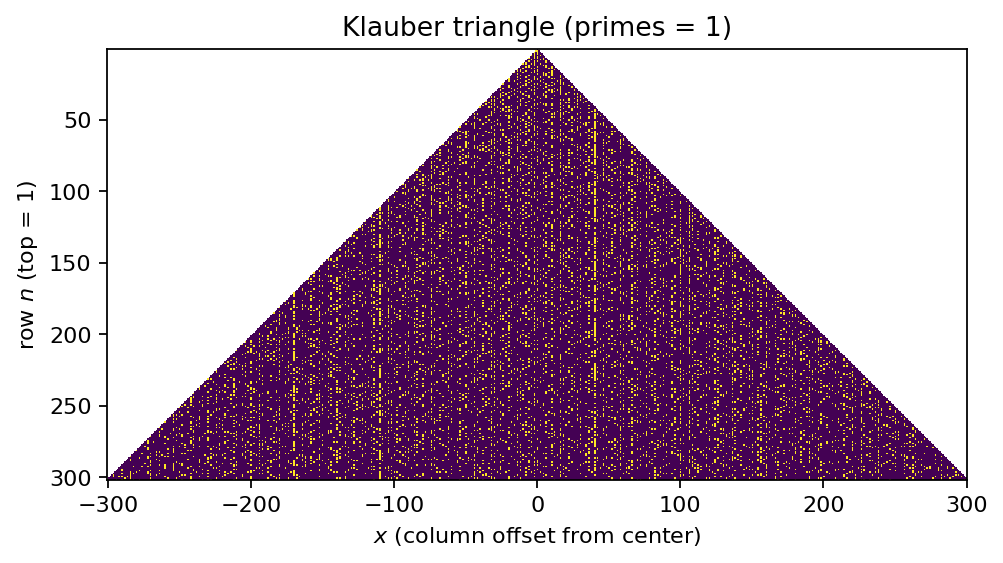
size 301: 90,601 numbers and 8,769 primes
size 401: 160,801 numbers and 14,752 primes

size 999: 998,001 numbers and 78,359 primes

Prime counts shown are \(\pi(\text{size}^2)\), i.e., the number of primes \(\le \text{size}^2\).
Tags: number-theory, quantitative-exploration, visualization
See: Valid Tags.
Highlights
A triangular “prime map” where row \(m\) contains the integers from \((m-1)^2+1\) to \(m^2\).
Parameterizable run: vary
--sizefrom the command line (default:301).Writes reproducible artifacts (
params.json,report.md, and figures) intoout/e124/.
Goal
Render the Klauber triangle (a square-number-based triangular arrangement) and highlight primes to reveal
linear “streaks” and other geometric structures, then compare how that structure changes as size increases.
Background (quick refresher)
What is the Klauber triangle?
The Klauber triangle arranges the natural numbers into rows indexed by \(m=1,2,3,\dots\) such that row \(m\) contains the consecutive integers
size contains the integers \(1,\dots,\text{size}^2\).
When primes are highlighted, surprisingly strong visual streaks can appear. See [Hill, 2016].
Optional background pages
Research question
Which prime-rich streaks are visible in the Klauber triangle for a given size, and how do those structures
change as size increases?
Why this qualifies as a mathematical experiment
Finite procedure: build a finite triangle window containing integers \(1,\dots,\text{size}^2\) and run a deterministic primality test.
Observable(s): streaks/lines, local clustering, and how visibility changes with
size.Parameter space:
size(and, if you extend it, rendering/annotation choices).Outcome: figures and a short report capturing the key observation and caveats.
Reproducibility: outputs saved to
out/e124/with a parameter snapshot.
Experiment design
Computation: place integers \(1,\dots,\text{size}^2\) into the Klauber triangle row rule; mark primes.
Coordinates: x is the integer column offset from the center column (0 at the center); the vertical axis is the row index \(n\) with \(n=1\) at the top.
Prime classification: primes are computed using a sieve up to \(\text{size}^2\).
Outputs: one or more figures showing prime positions in the triangle.
Artifacts written:
figures/fig_01_klauber_triangle*.png(main figure) andfigures/e124_hero_<size>.png(published hero)params.jsonreport.md
Plot axes and coordinate conventions
The triangle is indexed by a row number and a horizontal offset within that row:
y-axis: the row index \(m\in\{1,\dots,\text{size}\}\) (with \(m=1\) at the top)
x-axis: the integer column offset from the center of the row:
\[x\in\{-(m-1),\dots,(m-1)\}\]
For a given row \(m\) and offset \(x\), the corresponding integer in the Klauber triangle is:
This formula matches the construction “odd squares on the left edge”: the leftmost entry in row \(m\) is \(n(m,-(m-1))=(m-1)^2+1\), and the row increases by 1 as \(x\) moves to the right.
If the implementation renders the triangle as a 2D array with Matplotlib imshow, the extent should be chosen so that
tick labels correspond to the displayed \((x,m)\) values. When origin="upper" is used, \(m\) increases downward visually;
in that case, interpret the y-axis tick labels accordingly (or flip the axis via the extent).
How to run
make run EXP=e124
Override the triangle size:
make run EXP=e124 ARGS="--size 501"
Direct invocation (always works):
uv run --extra dev python -m mathxlab.experiments.e124 --out out/e124 --size 501
Notes / pitfalls
Larger
sizemeans more numbers (\(\text{size}^2\)) and a longer run time.“Looks-true” trap: visual regularity suggests hypotheses but does not prove theorems about primes.
Rendering choices (marker size, interpolation) can hide or exaggerate streaks.
Extensions
Quantify streaks: compute prime density along selected triangle-aligned lines and plot the densities.
Highlight the square boundaries (\(m^2\)) or row indices to relate features to the row rule.
Compare multiple sizes side-by-side (same styling and axis conventions).
Published run snapshot
If this experiment is included in the docs gallery, include the published snapshot (report + params).
Reproduce:
make run EXP=e124
Parameters
size:
301(odd); visualizes integers1..90601.
Notes
The triangle arranges row n as
(n-1)^2+1 .. n^2(row length2n-1).Prime-rich lines are linked to quadratic polynomials, similar to the Ulam spiral.
This experiment is deterministic;
seeddoes not change the output.
params.json (snapshot)
{
  "size": 301
}
References
Klauber triangle definition and examples: [Hill, 2016].
Exposition connecting multiple prime visualizations (includes Klauber and Sacks): [Brockmann, 2019].
Recreational-math context and “pattern traps”: [Gardner, 1983], [Hoffman, 1989].
See also References.
Parameters (example)
size:
301(triangle rows: 301, integers1..90,601)
Recommended size range
The Klauber triangle up to row size contains \(\text{size}^2\) integers, so runtime and memory scale roughly with \(\text{size}^2\).
A practical range that works well for most runs:
Minimum (still meaningful):
size = 101Default / recommended:
size = 301Comfortable upper range on typical laptops (varies):
size = 999Above ~
size = 1501: expect noticeably higher runtime (and potentially memory pressure), depending on the machine and the primality implementation.
Rule of thumb: start with 301, then try 501, 701, 901. Increase further only if runtime remains acceptable.
Summary
We render the Klauber triangle containing the first 90,601 positive integers and highlight primes. Even at this moderate scale, visually prominent streaks appear: some triangle-aligned lines contain noticeably more primes than nearby lines.
Key observations
Several streaks stand out strongly against a background that still looks relatively “noise-like”.
The most visible structures shift as
sizeincreases; some streaks weaken while others become clearer.
Interpretation
The Klauber triangle is a structured re-indexing of the integers where many visually straight features correspond to simple polynomial or arithmetic progressions in the underlying index. This makes it a useful “pattern detector” for prime-rich sequences, but it is not evidence of a global rule.
Caveats
Finite window: patterns can look stronger/weaker depending on the chosen
sizeand zoom level.Visualization choices matter: marker size and interpolation can hide or exaggerate streaks.
Different triangle conventions (if you change the row rule) change which streaks appear.