E114: ζ via η: stability map on the critical line
E114: ζ via η: stability map on the critical line
Tags: analysis, quantitative-exploration, visualization, riemann-zeta, critical-line, numerics
Highlights
Focused numeric experiment with a small set of figures.
Parameters saved to
params.jsonfor reproducibility.Defaults are chosen, so the experiment remains feasible for the CI “slow” suite.
What is computed
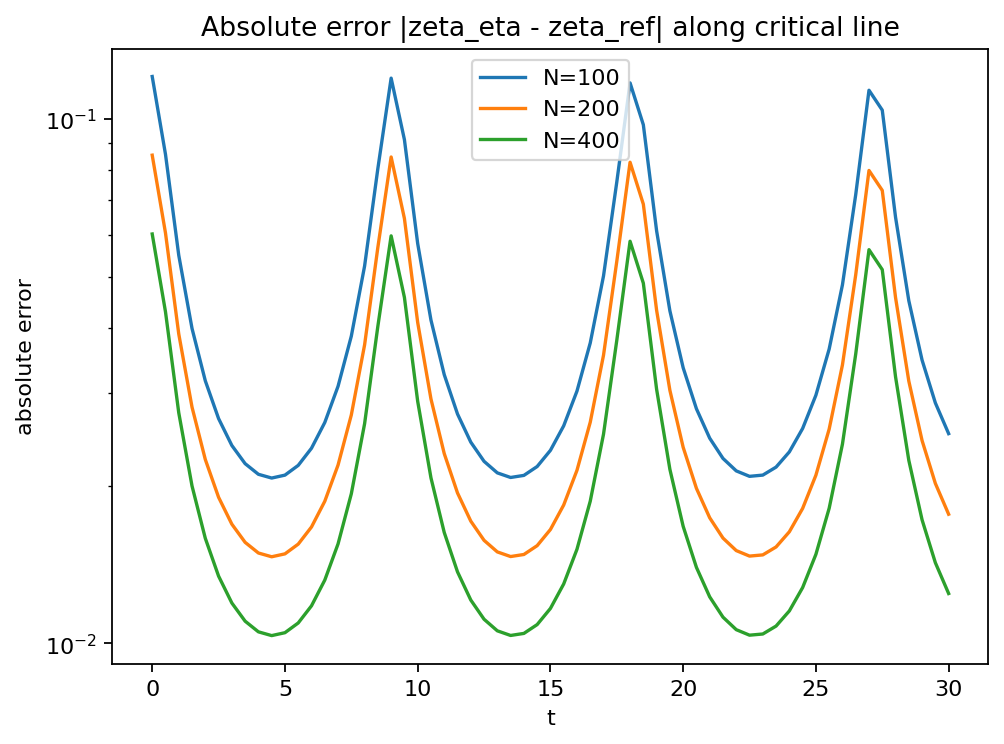
Study stability of ζ(1/2+it) via η-acceleration under truncation changes.
Notes
This page summarizes the intent; see the generated
report.mdinout/for concrete outputs.
Published run snapshot
If this experiment is included in the docs gallery, include the published snapshot (report + params).
Artifacts
figures/fig_01_eta_truncation_errors.png
params.json
report.md
Notes
n_terms -> max error: {100: ‘1.20e-01’, 200: ‘8.52e-02’, 400: ‘6.03e-02’}
η-series converges for Re(s)>0, but near Re(s)=1/2 the truncation error is still visible.
params.json (snapshot)
{
  "eval_dps": 50,
  "n_terms_values": [
    100,
    200,
    400
  ],
  "ref_dps": 70,
  "t_max": 30.0,
  "t_steps": 61
}
References
See the zeta / zeros background pages in
docs/background/.