E072: Prime race mod 4: pi(x;4,3) vs. pi(x;4,1).
Tags: number-theory, quantitative-exploration, visualization, prime-races, aps
Highlights
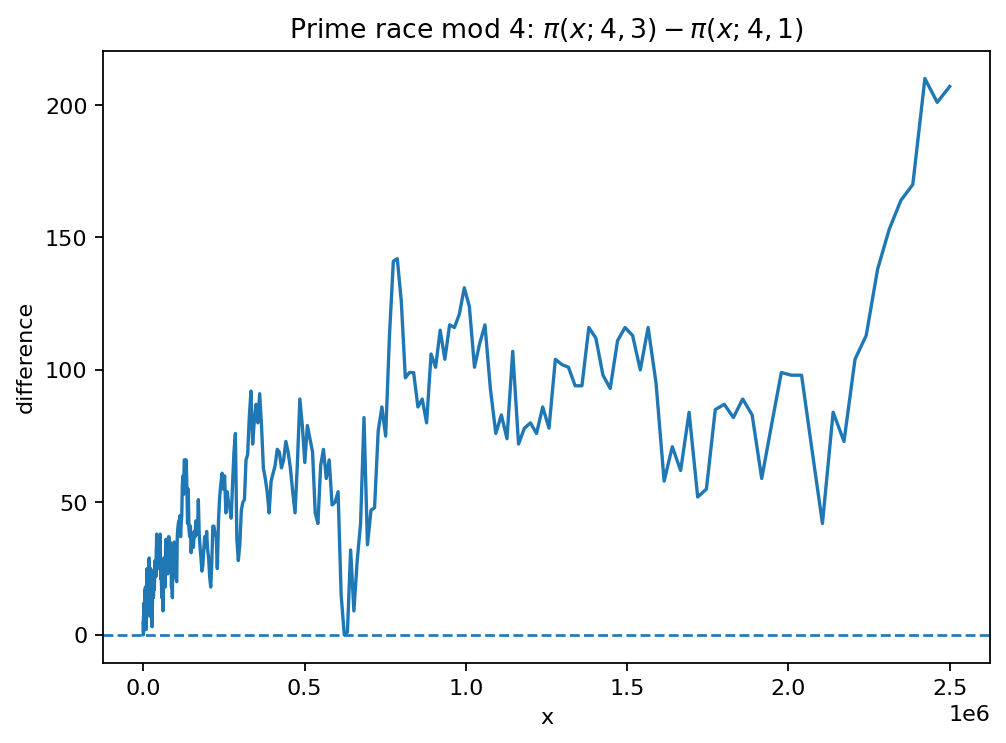
Computes prime-race differences π(x;q,a) − π(x;q,b) on a grid of x values.
Visualizes lead changes and the size of fluctuations as x grows.
Adds a derived statistic (normalization / θ-variant) to compare behaviors.
What this experiment does
A classical “prime race” compares how often one residue class leads another in prime counts. The most famous is mod 4:
The implementation focuses on a compact, reproducible numerical workflow: deterministic parameter defaults, structured output folders, and one or more figures saved for the gallery.
Outputs
This experiment writes into out/e072/:
figures/fig_01_race_mod4_diff.png
How to run
make run EXP=e072
Notes
The gallery preview figure shipped with the documentation uses conservative cutoffs so builds stay fast. If you run the experiment locally, increase the cutoffs to see the asymptotic regime more clearly.
Prime-race plots depend on the chosen sampling of
x(linear vs. log grid). The qualitative “who leads” picture can change when you zoom in.
Published run snapshot
If this experiment is included in the docs gallery, include the published snapshot (report + params).
x_max: 2500000
n_points: 900
log_grid: True
sign changes on sample grid: 0
Figure:
fig_01_race_mod4_diff.png
Notes:
The sample grid is not dense enough to capture every sign change; it gives a qualitative picture.
params.json (snapshot)
{
  "log_grid": true,
  "n_points": 900,
  "x_max": 2500000
}