E055: Mertens function walk
Tags: number-theory, quantitative-exploration, visualization, arithmetic-functions, mobius, summatory, model-checking
See: Valid Tags.
Highlights
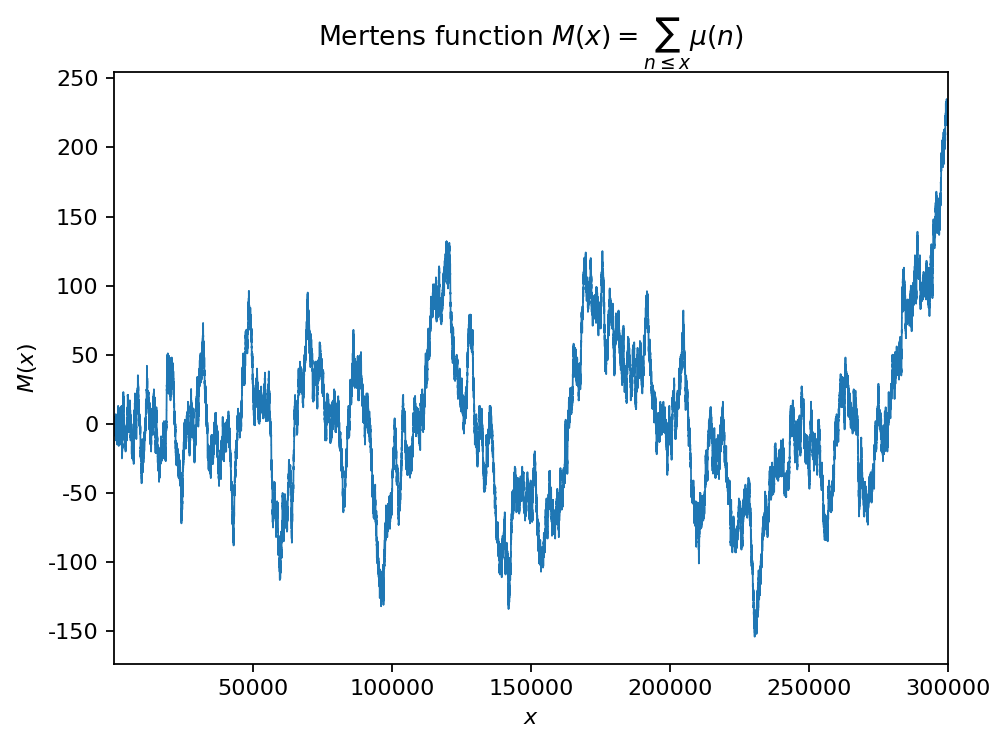
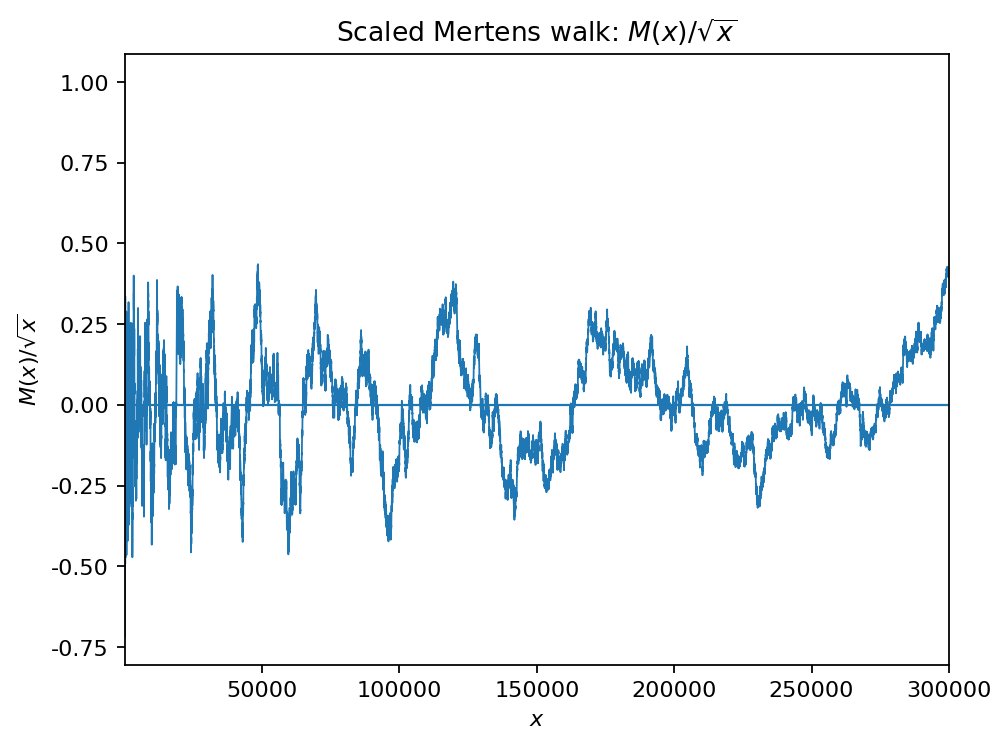
Plot \(M(x)\) and scaled variants such as \(M(x)/\sqrt{x}\).
Compare qualitative behavior to a simple random-walk heuristic (without overclaiming).
Goal
Build intuition for summatory Möbius behavior and typical fluctuation scales.
Background (quick refresher)
Research question
What does \(M(x)/\sqrt{x}\) look like numerically over moderate ranges?
Method
Compute \(\mu(n)\) up to \(N\) and cumulative sums \(M(x)\).
Plot \(M(x)\) and \(M(x)/\sqrt{x}\); optionally add moving-window statistics.
How to run
make run EXP=e055uv run python -m mathxlab.experiments.e055
Outputs
This experiment follows the standard output contract:
out/e055/figures/— generated figures (PNG)out/e055/report.md— short narrative reportout/e055/manifest.json— snapshot metadata for the gallery
Published run snapshot
If this experiment is included in the docs gallery, include the published snapshot (report + params).
n_max: 300000
max |M(x)| in range: 235
Figures:
fig_01_mertens.png
fig_02_mertens_scaled.png
params.json (snapshot)
{
  "n_max": 300000
}