E024: Ulam spiral structure
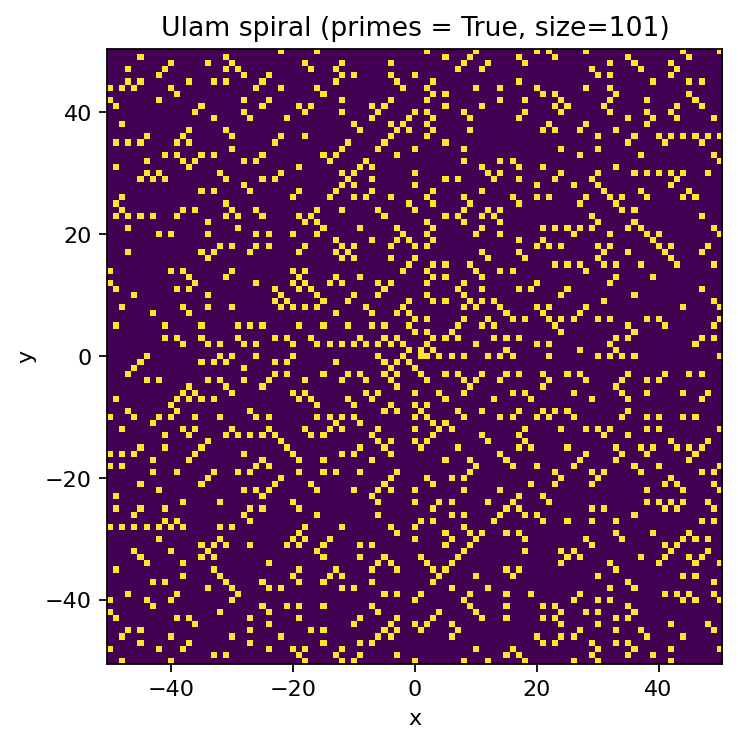
size 101: 10,201 numbers and 1,252 primes
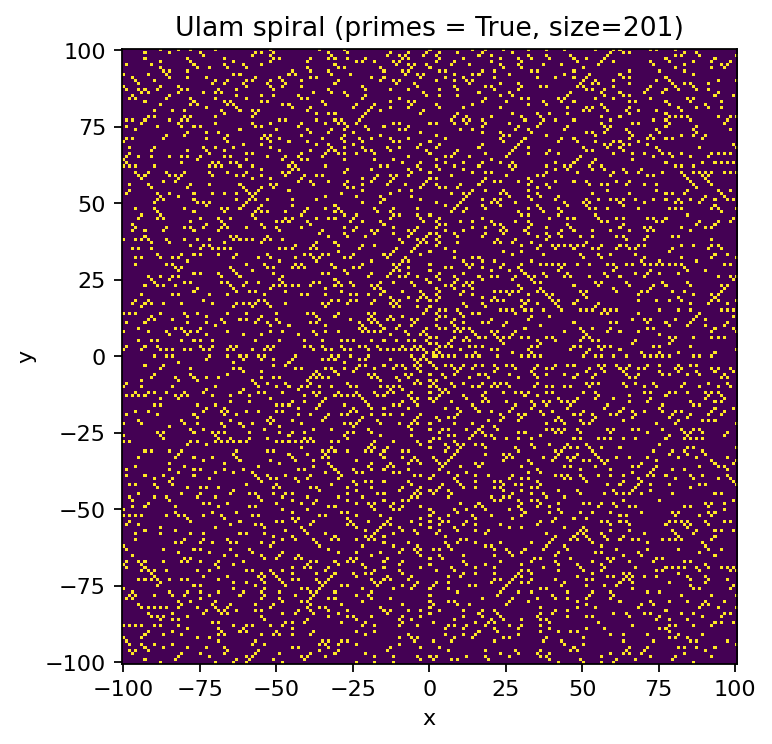
size 201: 40,401 numbers and 4,236 primes
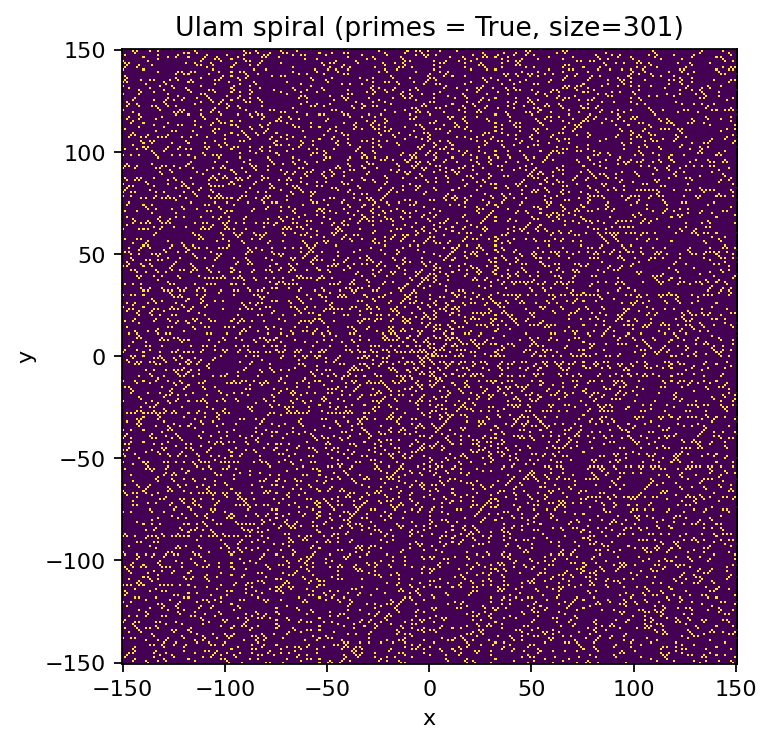
size 301: 90,601 numbers and 8,769 primes
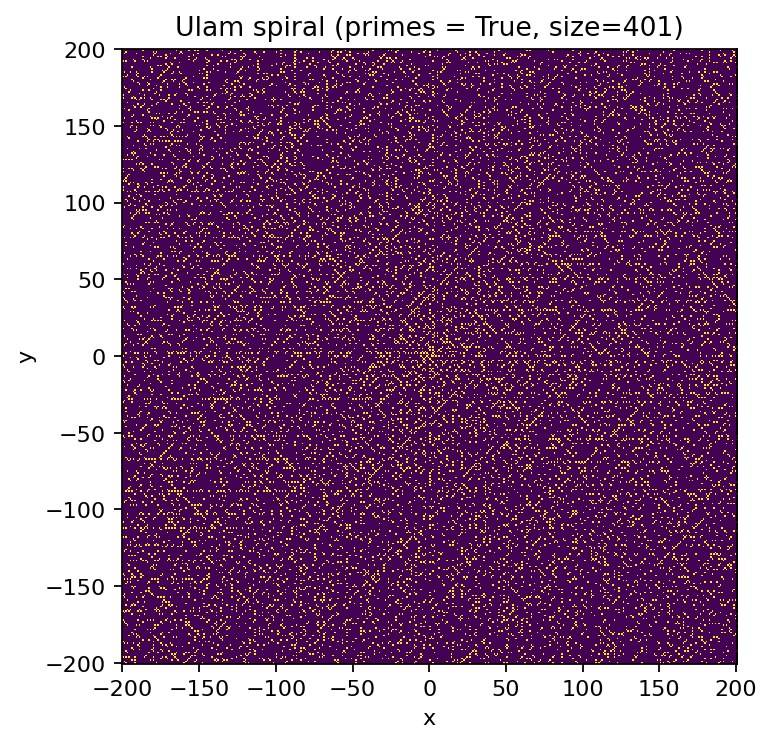
size 401: 160,801 numbers and 14,752 primes
size 999: 998,001 numbers and 78,359 primes
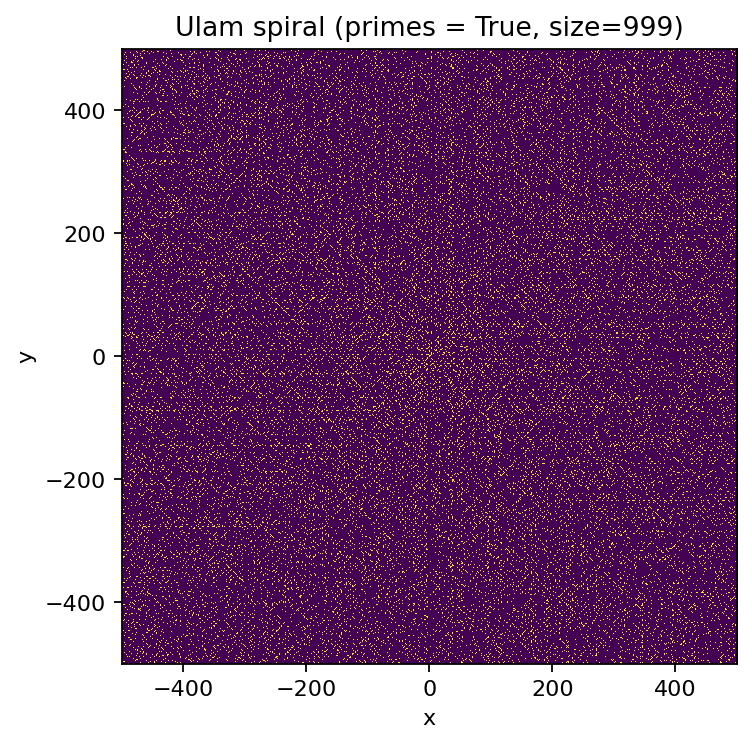
Prime counts shown are \(\pi(\text{size}^2)\), i.e., the number of primes \(\le \text{size}^2\).
Tags: number-theory, quantitative-exploration, visualization
See: Valid Tags.
Highlights
Visual “pattern detector” for primes: highlights a diagonal structure that emerges in the Ulam spiral.
Parameterizable run: vary
--sizefrom the command line (default:301).Writes reproducible artifacts (
params.json,report.md, and figures) intoout/e024/.
Goal
Render an Ulam spiral and highlight primes on the spiral grid to make diagonal structure (prime-rich diagonals) visible, then compare how that structure changes as the spiral size increases.
Background (quick refresher)
What is an Ulam spiral?
An Ulam spiral places the positive integers on a square spiral (starting at 1 in the center, then winding outward) and then marks which positions are prime. A striking visual phenomenon appears: primes cluster along certain diagonals. A common explanation is that many diagonals correspond to simple quadratic polynomials in the spiral index; some of these produce unusually many primes for small inputs. See [contributors, 2025].
Optional background pages
Research question
Which diagonals (or families of diagonals) in the Ulam spiral show unusually high prime density for a given window size,
and how does that visual structure change as size increases?
Why this qualifies as a mathematical experiment
Finite procedure: build a finite spiral window and run a deterministic primality test up to \(\text{size}^2\).
Observable(s): diagonal structure, local “prime-rich” streaks, and how visibility changes with
size.Parameter space: the window size
size(and, if you extend it, rendering/annotation choices).Outcome: figures and a short report capturing the key observation and caveats.
Reproducibility: outputs saved to
out/e024/with a parameter snapshot.
Experiment design
Computation: map integers \(1,\dots,\text{size}^2\) to lattice coordinates on a square spiral; mark primes.
Coordinates: are centered at (0,0) in the middle of the grid; x increases to the right, y increases upward; the spiral starts with 1 at the origin, then moves right to 2, and continues counterclockwise outward.
Prime classification: primes are computed using a sieve up to \(\text{size}^2\).
Outputs: one or more figures showing prime positions on the spiral grid.
Artifacts written:
figures/fig_01_ulam_spiral*.png(main figure) andfigures/e024_hero_<size>.png(published hero)params.jsonreport.md
Plot axes and coordinate conventions
The spiral is plotted on a centered Cartesian grid:
x-axis: horizontal offset from the center cell (0 at the center, negative left, positive right)
y-axis: vertical offset from the center cell (0 at the center, negative down, positive up)
With an odd window size size, define \(k=(\text{size}-1)/2\). The visible coordinate range is then
\(x,y\in\{-k,\dots,k\}\).
If the implementation renders a 2D array with Matplotlib imshow, make sure the axis tick labels match these offsets
(using an extent such as (-k-0.5, k+0.5, -k-0.5, k+0.5) and a consistent origin). When origin="upper" is used,
the y-axis is flipped visually; interpret tick labels accordingly.
How to run
make run EXP=e024
Override the spiral size (must be odd):
make run EXP=e024 ARGS="--size 501"
Direct invocation (always works):
uv run --extra dev python -m mathxlab.experiments.e024 --out out/e024 --size 501
Notes / pitfalls
sizemust be odd so that the spiral has a single center cell.Larger
sizemeans more numbers (\(\text{size}^2\)) and a longer run time.“Looks-true” trap: visual regularity suggests hypotheses but does not prove theorems about primes.
Extensions
Add a “diagonal density” quantitative overlay: estimate prime density per diagonal and plot it.
Annotate diagonals with the corresponding quadratic polynomials (for small windows).
Compare multiple sizes side-by-side (same styling and axis conventions).
Published run snapshot
If this experiment is included in the docs gallery, include the published snapshot (report + params).
Reproduce:
make run EXP=e024
Parameters
size:
301
Notes
Diagonal streaks correspond to quadratic polynomials that produce many primes for small n.
This is a visual ‘pattern trap’: structure is real, but it does not imply a simple rule for primes.
params.json (snapshot)
{
  "size": 301
}
References
Ulam spiral overview and basic properties: [contributors, 2025].
Popular exposition and recreational-math context: [Gardner, 1983].
Narrative-style discussion of mathematical discovery/pitfalls (useful for “looks-true” effects): [Hoffman, 1989].
See also References.
Parameters (example)
size:
301(implied grid: 301 × 301, integers1..90,601)
Recommended size range
The Ulam spiral is computed on a size × size grid, so runtime and memory scale roughly with \(\text{size}^2\) (because about \(\text{size}^2\) integers are classified as prime/not-prime).
A practical range that works well for most runs:
Minimum (still meaningful):
size = 101Default / recommended:
size = 301Comfortable upper range on typical laptops (varies):
size = 999Above ~
size = 1501: expect noticeably higher runtime (and potentially memory pressure), depending on the machine and the primality implementation.
Rule of thumb: start with 301, then try 501, 701, 901. Increase further only if runtime remains acceptable.
Summary
We render the classic Ulam spiral for the first 90,601 positive integers and highlight primes on the spiral grid. Even at this moderate scale, faint diagonal “streaks” are visible: some diagonals contain noticeably more primes than nearby diagonals.
Key observations
Several diagonals show higher prime density than the surrounding background.
Many regions still look close to “noise-like” at this resolution; the strongest diagonal effects are easiest to see when zooming.
Interpretation
The diagonal structure is a real phenomenon and is commonly explained by the fact that many diagonals correspond to simple quadratic polynomials in the spiral index; some quadratics produce unusually many primes for small inputs. This is therefore a useful “pattern detector” for prime-rich formulas — but it is not evidence that primes follow a simple global rule.
Caveats
Finite window: patterns can look stronger/weaker depending on the chosen size and zoom level.
Visualization choices matter: marker size and interpolation can hide or exaggerate diagonal structure.
Grid mapping details (exact spiral convention and indexing) affect which diagonals appear most prominent.