E087: Gram points and spacing
E087: Gram points and spacing
Tags: analysis, quantitative-exploration, visualization, riemann-zeta, gram-points, zeta-zeros, numerics
Highlights
Focused numeric experiment with a single main figure.
Parameters saved to
params.jsonfor reproducibility.Lightweight computation suitable for CI “slow” suite (small defaults).
What is computed
A parameterized numeric evaluation related to the Riemann zeta function.
A visualization summarizing the main phenomenon for the chosen parameter range.
Algorithm sketch
Build the numeric grid / sampling points.
Evaluate the target quantity with controlled truncation.
Render the figure and write a short report.
Outputs
report.md— short narrative summaryparams.json— experiment parameters snapshotfigures/fig_01_gram_points_spacing.png— main figure
Published run snapshot
If this experiment is included in the docs gallery, include the published snapshot (report + params).
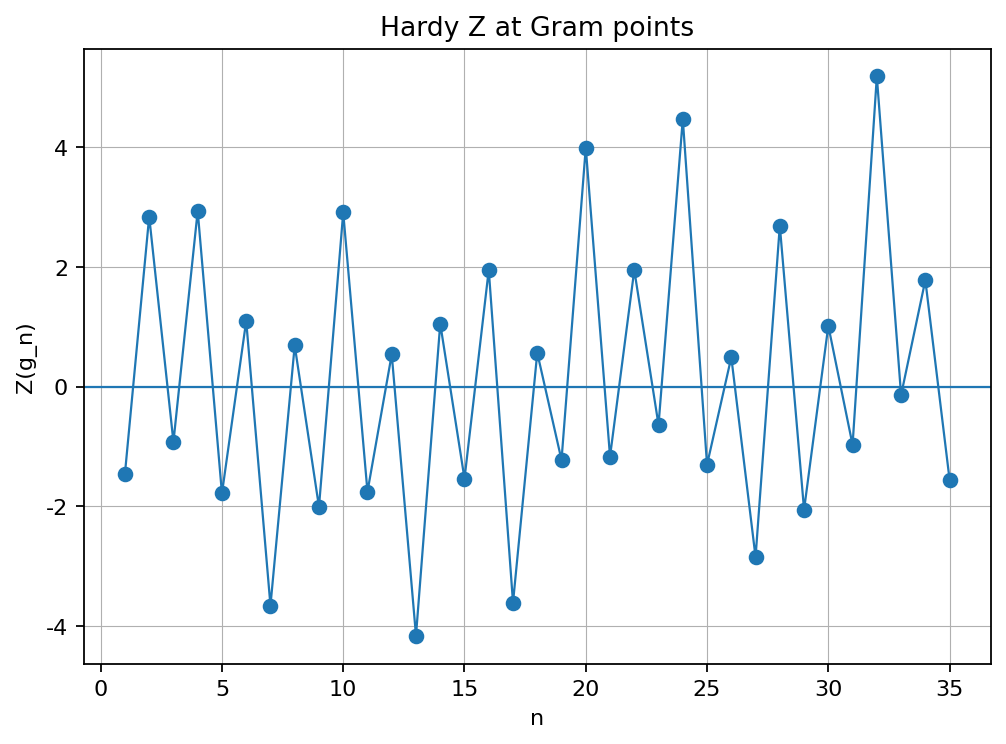
We computed Gram points g_n for n in [1, 35] and sampled Hardy Z(g_n).
Observed sign changes between consecutive Gram points (simple count): 34.
params.json (snapshot)
{
  "mp_dps": 60,
  "n_end": 35,
  "n_start": 1
}