E089: log|ζ(s)| heatmap
E089: log|ζ(s)| heatmap
Tags: analysis, quantitative-exploration, visualization, riemann-zeta, numerics
Highlights
Focused numeric experiment with a single main figure.
Parameters saved to
params.jsonfor reproducibility.Lightweight computation suitable for CI “slow” suite (small defaults).
What is computed
A parameterized numeric evaluation related to the Riemann zeta function.
A visualization summarizing the main phenomenon for the chosen parameter range.
Algorithm sketch
Build the numeric grid / sampling points.
Evaluate the target quantity with controlled truncation.
Render the figure and write a short report.
Outputs
report.md— short narrative summaryparams.json— experiment parameters snapshotfigures/fig_01_zeta_heatmap_logabs.png— main figure
Published run snapshot
If this experiment is included in the docs gallery, include the published snapshot (report + params).
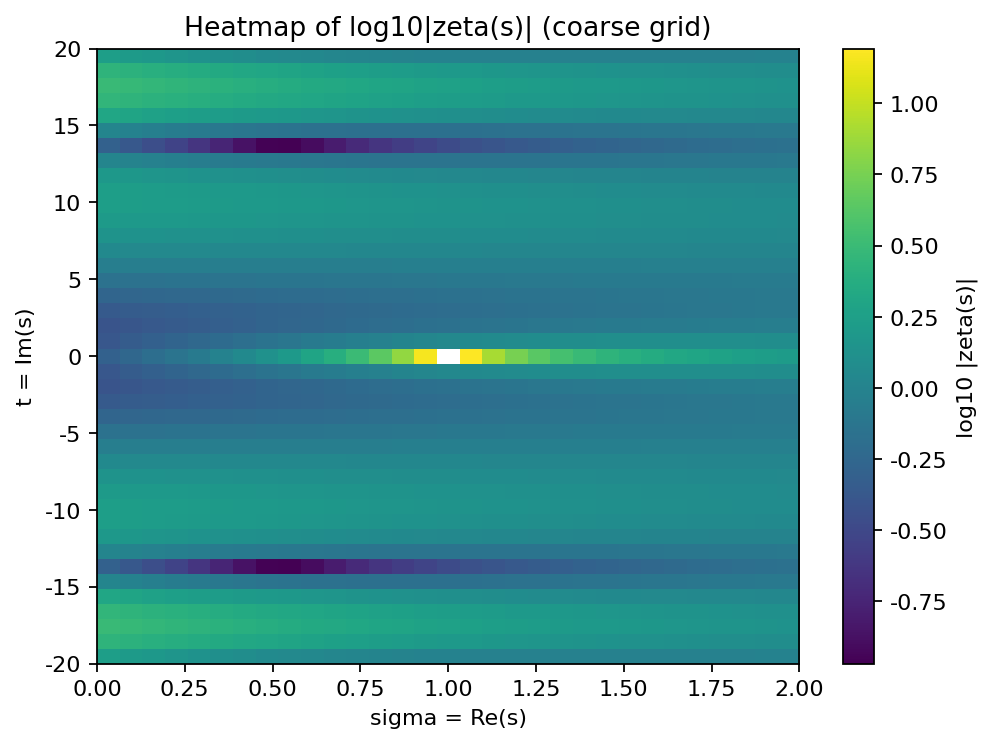
We plot log10|zeta(s)| on a coarse grid in the (sigma, t) plane. The pole at s=1 manifests as a bright region near sigma=1, t=0.
params.json (snapshot)
{
  "mp_dps": 50,
  "n_sigma": 31,
  "n_t": 41,
  "sigma_max": 2.0,
  "sigma_min": 0.0,
  "t_max": 20.0,
  "t_min": -20.0
}