E074: Prime race mod 8: leaderboard among 1,3,5,7.
Tags: number-theory, quantitative-exploration, visualization, prime-races, aps
Highlights
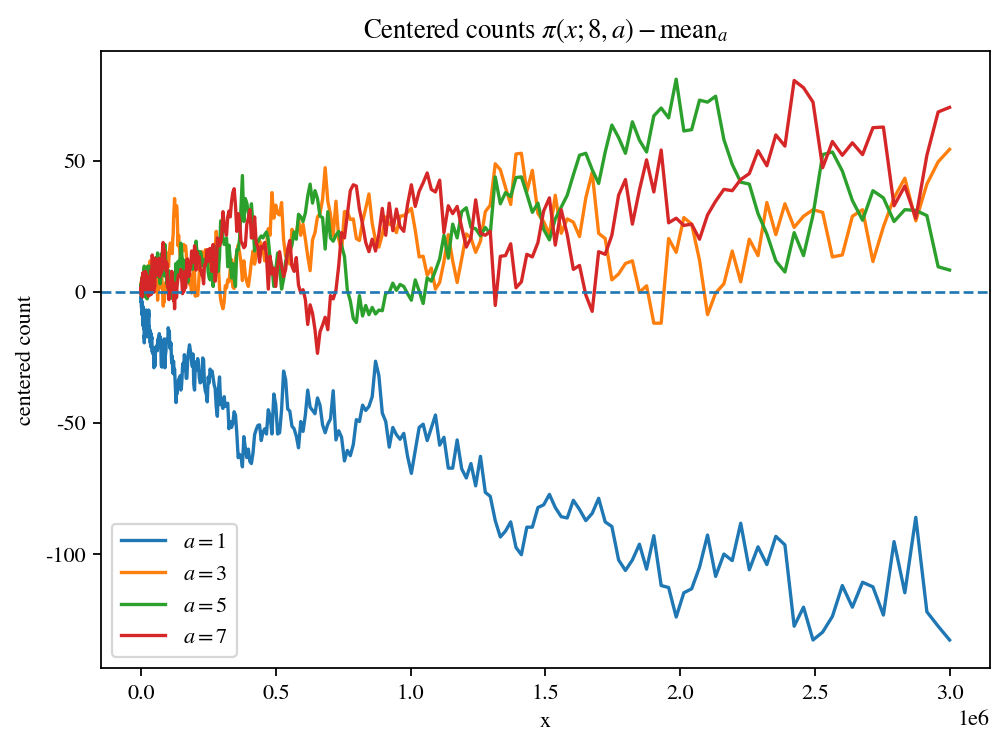
Computes prime-race differences π(x;q,a) − π(x;q,b) on a grid of x values.
Visualizes lead changes and the size of fluctuations as x grows.
Adds a derived statistic (normalization / θ-variant) to compare behaviors.
What this experiment does
This experiment tracks four residue classes modulo 8:
The implementation focuses on a compact, reproducible numerical workflow: deterministic parameter defaults, structured output folders, and one or more figures saved for the gallery.
Outputs
This experiment writes into out/e074/:
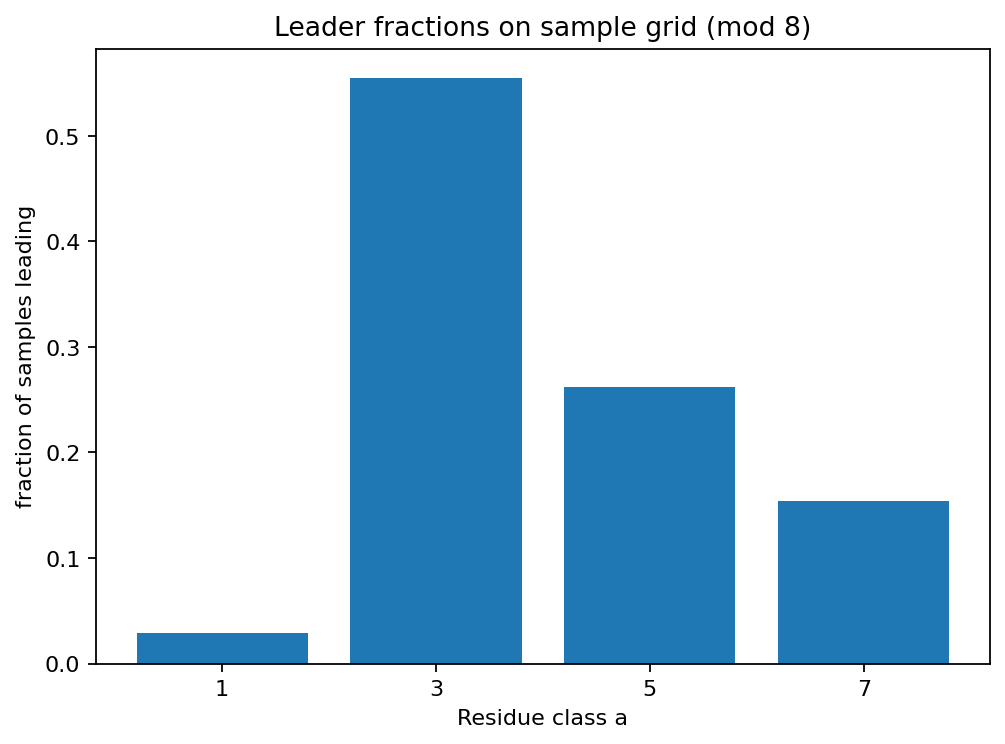
figures/fig_01_leader_fractions.pngfigures/fig_02_counts_minus_mean.png
How to run
make run EXP=e074
Notes
The gallery preview figure shipped with the documentation uses conservative cutoffs so builds stay fast. If you run the experiment locally, increase the cutoffs to see the asymptotic regime more clearly.
Prime-race plots depend on the chosen sampling of
x(linear vs. log grid). The qualitative “who leads” picture can change when you zoom in.
Published run snapshot
If this experiment is included in the docs gallery, include the published snapshot (report + params).
x_max: 3000000
residues: [1, 3, 5, 7]
n_points: 1000
log_grid: True
Leader fractions on the sample grid:
a=1: 0.029
a=3: 0.555
a=5: 0.262
a=7: 0.154
Figures:
fig_01_leader_fractions.png
fig_02_counts_minus_mean.png
Notes:
This uses a coarse sample grid, so fractions are approximate and depend on sampling.
params.json (snapshot)
{
  "log_grid": true,
  "n_points": 1000,
  "residues": [
    1,
    3,
    5,
    7
  ],
  "x_max": 3000000
}