E084: |ζ(1/2+it)| growth snapshots
E084: |ζ(1/2+it)| growth snapshots
Tags: analysis, quantitative-exploration, visualization, riemann-zeta, critical-line, numerics
Highlights
Focused numeric experiment with a single main figure.
Parameters saved to
params.jsonfor reproducibility.Lightweight computation suitable for CI “slow” suite (small defaults).
What is computed
A parameterized numeric evaluation related to the Riemann zeta function.
A visualization summarizing the main phenomenon for the chosen parameter range.
Algorithm sketch
Build the numeric grid / sampling points.
Evaluate the target quantity with controlled truncation.
Render the figure and write a short report.
Outputs
report.md— short narrative summaryparams.json— experiment parameters snapshotfigures/fig_01_critical_line_logabs.png— main figure
Published run snapshot
If this experiment is included in the docs gallery, include the published snapshot (report + params).
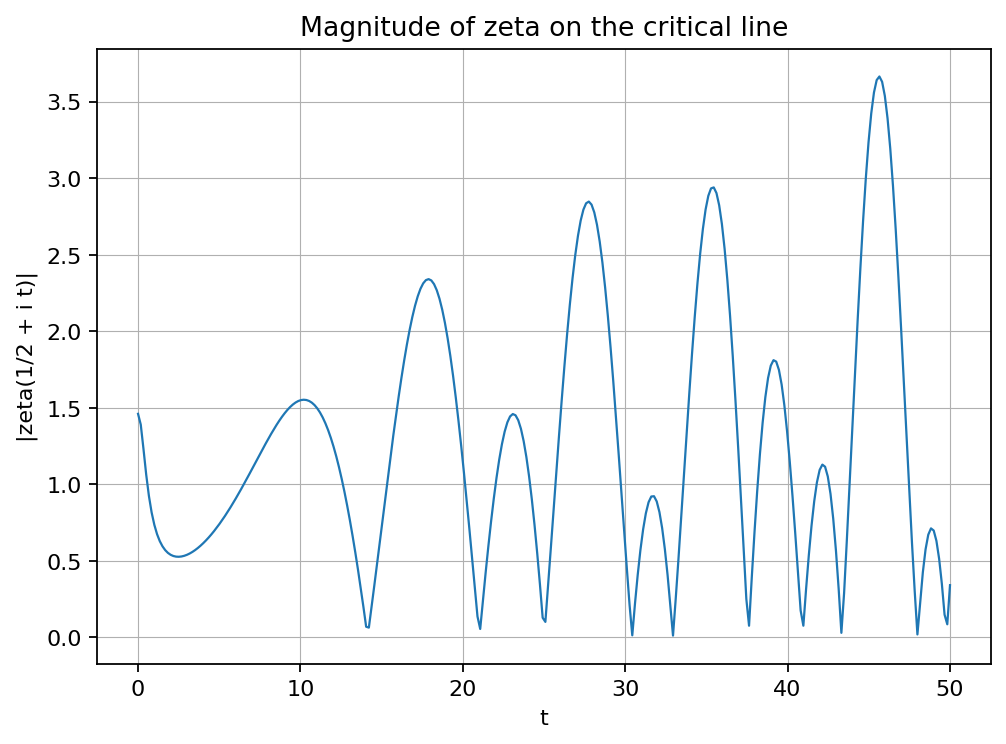
We sample the magnitude of zeta(s) along the critical line s = 1/2 + i t on a moderate t-range.
params.json (snapshot)
{
  "mp_dps": 50,
  "n_points": 300,
  "t_max": 50.0
}