E081: Prime race sign changes: first crossings table.
Tags: number-theory, quantitative-exploration, visualization, prime-races
Highlights
Estimates the fraction of x where one residue class leads another.
Plots a running bias estimate over log-sampled x values.
Detects coarse sign-change neighborhoods for the race difference.
What this experiment does
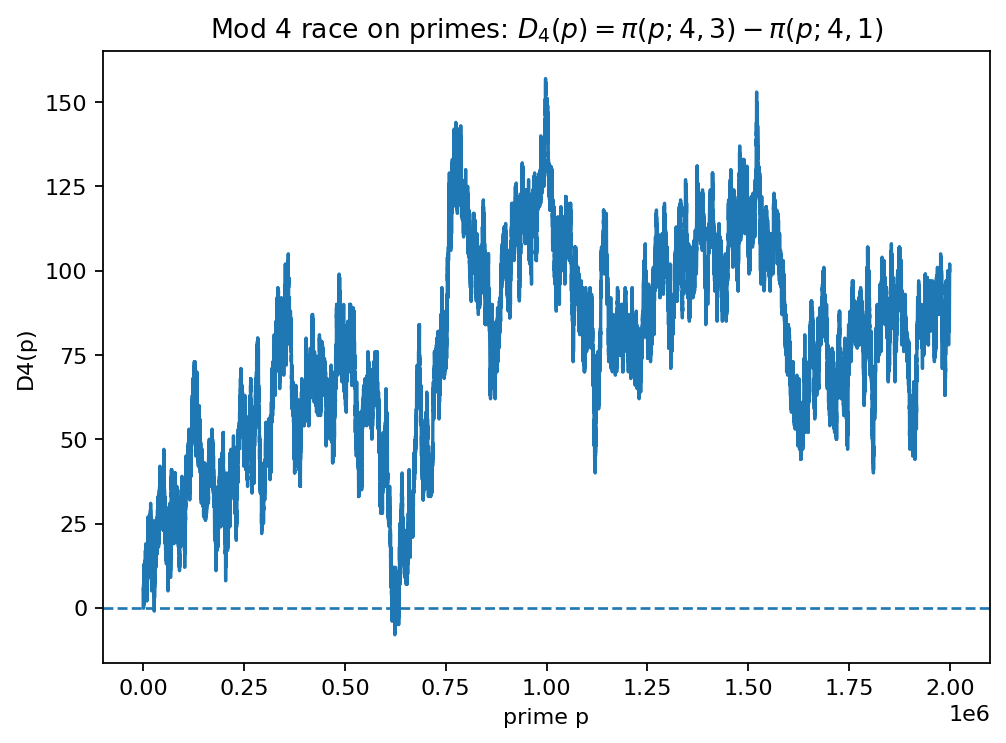
A prime race difference D(x) only changes when x passes a prime. We can track sign changes by iterating primes in order.
The implementation focuses on a compact, reproducible numerical workflow: deterministic parameter defaults, structured output folders, and one or more figures saved for the gallery.
Outputs
This experiment writes into out/e081/:
figures/fig_01_mod4_diff_on_primes.png
How to run
make run EXP=e081
Notes
The gallery preview figure shipped with the documentation uses conservative cutoffs so builds stay fast. If you run the experiment locally, increase the cutoffs to see the asymptotic regime more clearly.
Prime-race plots depend on the chosen sampling of
x(linear vs. log grid). The qualitative “who leads” picture can change when you zoom in.
Published run snapshot
If this experiment is included in the docs gallery, include the published snapshot (report + params).
x_max (search): 25000000
max_changes: 20
Mod 4: D4(x)=pi(x;4,3)-pi(x;4,1)
# |
prime p |
D after |
|---|---|---|
1 |
26861 |
-1 |
2 |
26879 |
1 |
3 |
616841 |
-1 |
4 |
617039 |
1 |
5 |
617269 |
-1 |
6 |
617471 |
1 |
7 |
617521 |
-1 |
8 |
617587 |
1 |
9 |
617689 |
-1 |
10 |
617723 |
1 |
11 |
622813 |
-1 |
12 |
623387 |
1 |
13 |
623401 |
-1 |
14 |
623851 |
1 |
15 |
623933 |
-1 |
16 |
624031 |
1 |
17 |
624097 |
-1 |
18 |
624191 |
1 |
19 |
624241 |
-1 |
20 |
624259 |
1 |
Mod 3: D3(x)=pi(x;3,2)-pi(x;3,1)
(No sign change found in range.)
Figure:
fig_01_mod4_diff_on_primes.png
Notes:
Sign changes are detected at prime steps where D jumps.
If no sign change appears, increase x_max.
params.json (snapshot)
{
  "max_changes": 20,
  "plot_max": 2000000,
  "x_max": 25000000
}