E090: Functional equation residual heatmap
E090: Functional equation residual heatmap
Tags: analysis, quantitative-exploration, visualization, riemann-zeta, numerics
Highlights
Focused numeric experiment with a single main figure.
Parameters saved to
params.jsonfor reproducibility.Defaults are chosen, so the experiment remains feasible for the CI “slow” suite.
What is computed
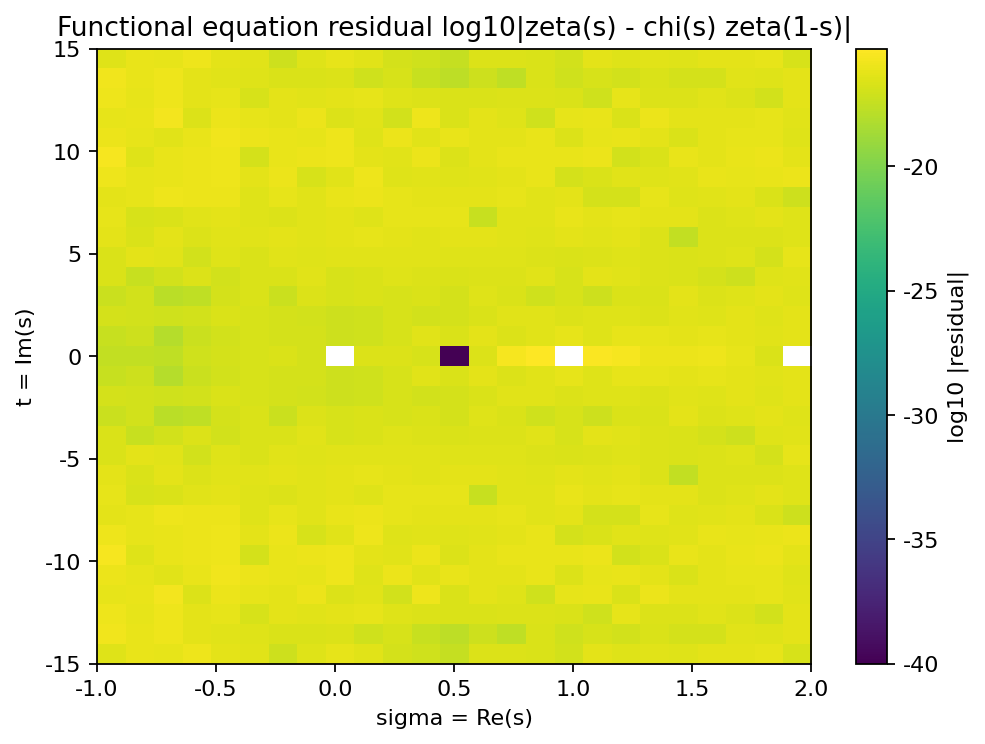
Evaluate the functional-equation residual (R(s)=\zeta(s)-\chi(s),\zeta(1-s)) on a small rectangle on the complex plane.
Visualize
log10(|R(s)| + eps)as a heatmap.
Notes
This is a sanity-check style plot: away from poles/zeros and with sufficient precision, the residual should be small.
Parameters control precision and grid size.
Published run snapshot
If this experiment is included in the docs gallery, include the published snapshot (report + params).
We visualize log10|zeta(s) - chi(s) zeta(1-s)| on a coarse grid. Away from the pole at s=1, the residual should be close to numerical precision.
params.json (snapshot)
{
  "mp_dps": 70,
  "n_sigma": 25,
  "n_t": 31,
  "sigma_max": 2.0,
  "sigma_min": -1.0,
  "t_max": 15.0,
  "t_min": -15.0
}
References
See the zeta / Dirichlet-series references in
refs.bib.