E064: Dirichlet character tables (phase view).
Tags: number-theory, quantitative-exploration, visualization, dirichlet-characters
Highlights
Constructs full character tables for a small modulus q.
Visualizes values as phases / real parts to spot structure and symmetries.
Checks orthogonality and basic sanity constraints numerically.
What this experiment does
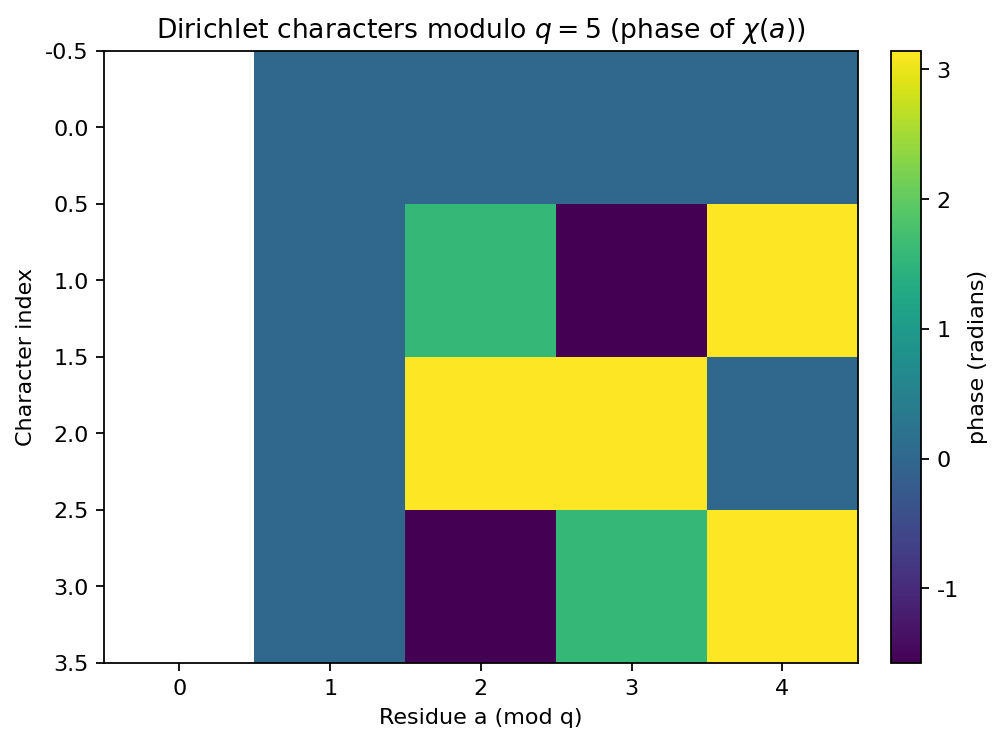
This experiment enumerates all Dirichlet characters modulo a small modulus q and visualizes the values χ(a) for residues a=0..q-1.
The implementation focuses on a compact, reproducible numerical workflow: deterministic parameter defaults, structured output folders, and one or more figures saved for the gallery.
Outputs
This experiment writes into out/e064/:
figures/fig_01_character_phases.png
How to run
make run EXP=e064
Notes
The gallery preview figure shipped with the documentation uses conservative cutoffs so builds stay fast. If you run the experiment locally, increase the cutoffs to see the asymptotic regime more clearly.
Prime-race plots depend on the chosen sampling of
x(linear vs. log grid). The qualitative “who leads” picture can change when you zoom in.
Published run snapshot
If this experiment is included in the docs gallery, include the published snapshot (report + params).
q: 5
phi(q): 4
Figure:
fig_01_character_phases.png
Notes:
Non-units (gcd(a,q)>1) are shown as missing values.
The principal character appears as the first row (all phases 0 on units).
params.json (snapshot)
{
  "q": 5
}