E059: Abundancy index landscape
Tags: number-theory, quantitative-exploration, visualization, arithmetic-functions, sigma, divisor-function, perfect
See: Valid Tags.
Highlights
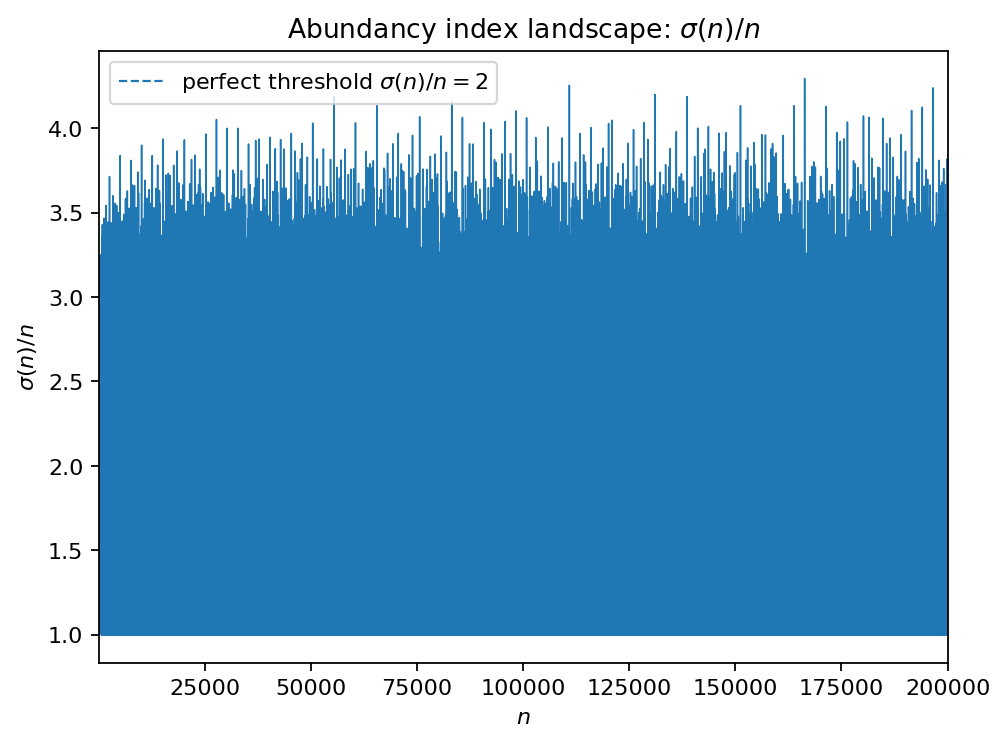
Plot \(\sigma(n)/n\) and mark the threshold 2 (perfect numbers).
Highlight spikes caused by many small prime factors.
Goal
Connect a divisor-sum function to the perfect/abundant classification visually.
Background (quick refresher)
Research question
What shapes and spikes appear in \(\sigma(n)/n\) over moderate ranges, and where do perfect numbers sit?
Method
Compute \(\sigma(n)\) up to \(N\) using factorization via SPF.
Plot \(\sigma(n)/n\) and annotate known perfect numbers in range.
How to run
make run EXP=e059uv run python -m mathxlab.experiments.e059
Outputs
This experiment follows the standard output contract:
out/e059/figures/— generated figures (PNG)out/e059/report.md— short narrative reportout/e059/manifest.json— snapshot metadata for the gallery
Published run snapshot
If this experiment is included in the docs gallery, include the published snapshot (report + params).
n_max: 200000
Top 12 values of σ(n)/n (value, n):
4.29437 at n=166320
4.25455 at n=110880
4.23932 at n=196560
4.20000 at n=131040
4.18701 at n=138600
4.18701 at n=55440
4.15584 at n=83160
4.13333 at n=163800
4.13333 at n=151200
4.13333 at n=65520
4.12941 at n=171360
4.12430 at n=194040
Figure:
fig_01_sigma_over_n.png
params.json (snapshot)
{
  "n_max": 200000,
  "top_k": 12
}