E086: Hardy Z(t) near zeros
E086: Hardy Z(t) near zeros
Tags: analysis, quantitative-exploration, visualization, riemann-zeta, zeta-zeros, critical-line, numerics
Highlights
Focused numeric experiment with a single main figure.
Parameters saved to
params.jsonfor reproducibility.Lightweight computation suitable for CI “slow” suite (small defaults).
What is computed
A parameterized numeric evaluation related to the Riemann zeta function.
A visualization summarizing the main phenomenon for the chosen parameter range.
Algorithm sketch
Build the numeric grid / sampling points.
Evaluate the target quantity with controlled truncation.
Render the figure and write a short report.
Outputs
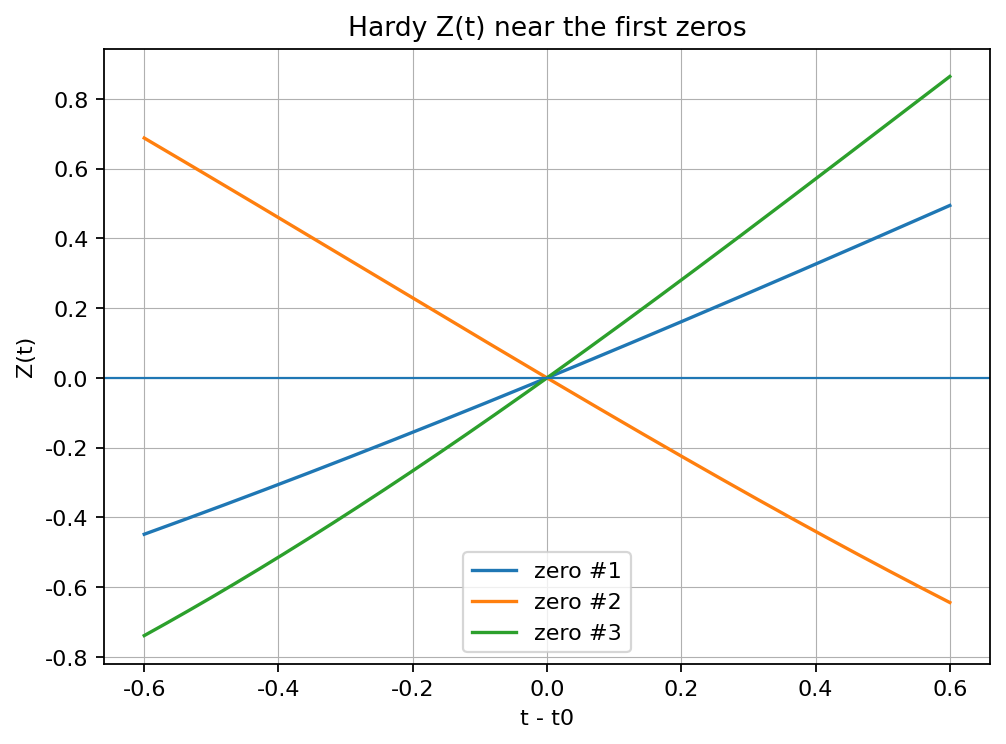
report.md— short narrative summaryparams.json— experiment parameters snapshotfigures/fig_01_hardy_Z_near_zeros.png— main figure
Published run snapshot
If this experiment is included in the docs gallery, include the published snapshot (report + params).
We locate the first few imaginary parts of non-trivial zeros (via mpmath) and sample Hardy’s Z(t) in a small window around each zero.
params.json (snapshot)
{
  "mp_dps": 60,
  "n_points": 400,
  "n_zeros": 3,
  "window": 0.6
}