E057: Erdős–Kac in practice
Tags: number-theory, quantitative-exploration, visualization, arithmetic-functions, omega, heuristics
See: Valid Tags.
Highlights
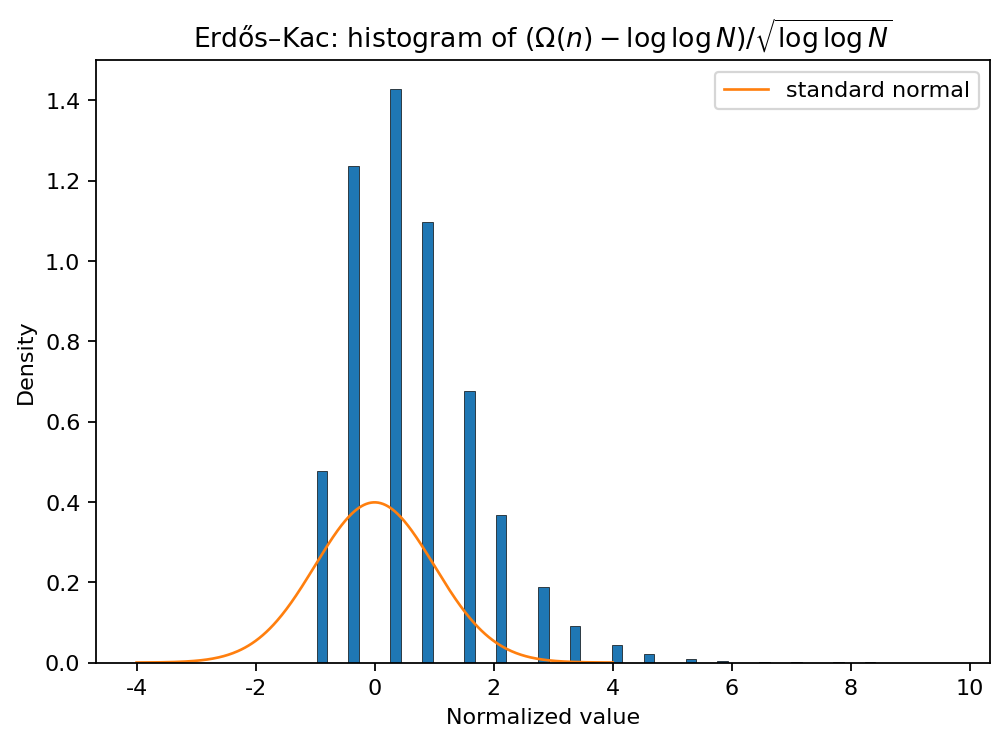
Compute \(\Omega(n)\) for \(n\le N\) and plot its histogram.
Optionally normalize to compare with a Gaussian curve (Erdős–Kac heuristic).
Goal
Visualize the probabilistic number-theory flavor of prime-factor counts.
Background (quick refresher)
Research question
How close does the distribution of \(\Omega(n)\) (after normalization) look to a normal curve for moderate \(N\)?
Method
Compute \(\Omega(n)\) using an SPF sieve.
Plot histogram; optionally overlay a normal density with matching mean/variance approximations.
How to run
make run EXP=e057uv run python -m mathxlab.experiments.e057
Outputs
This experiment follows the standard output contract:
out/e057/figures/— generated figures (PNG)out/e057/report.md— short narrative reportout/e057/manifest.json— snapshot metadata for the gallery
Published run snapshot
If this experiment is included in the docs gallery, include the published snapshot (report + params).
n_max: 400000
bins: 60
Figure:
fig_01_erdos_kac_hist.png
params.json (snapshot)
{
  "bins": 60,
  "n_max": 400000
}